What you'll need
Skill level: Advanced
Time Required: 25 minutes
- Zendesk Explore Professional or Enterprise
- Editor or Admin permissions (see Giving agents access to Explore)
- Ticket data in Zendesk Support
Creating the query
To create the query
- In Explore, navigate to the Queries library by clicking the query (
 ) icon.
 - Click New query.
- On the Choose a dataset page, click Support > Tickets > Support: Tickets, then click New query. The query builder will open for you.
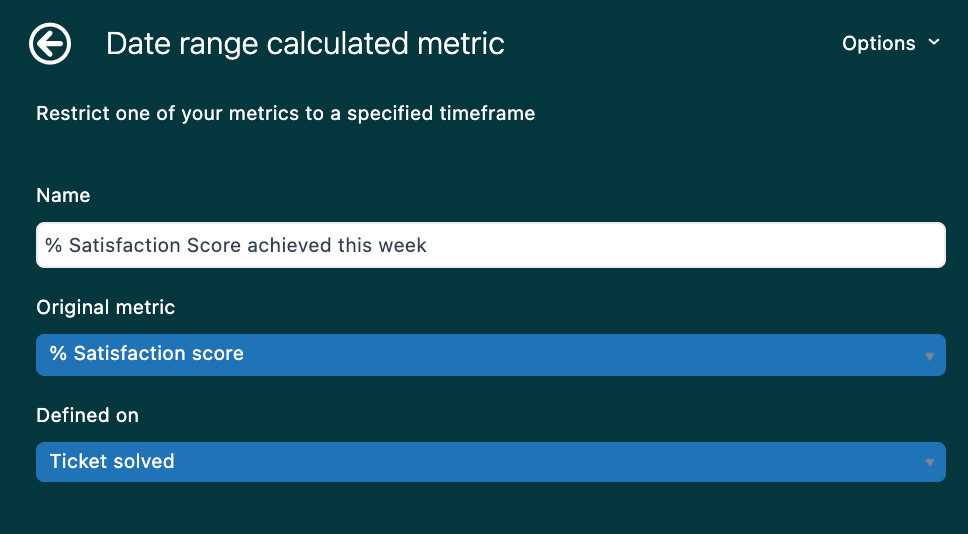
- Now, create Date range calculated metrics to show the percentage of CSAT targets that were met in each date range. From the Calculations (
 ) menu, click Date range calculated metric.
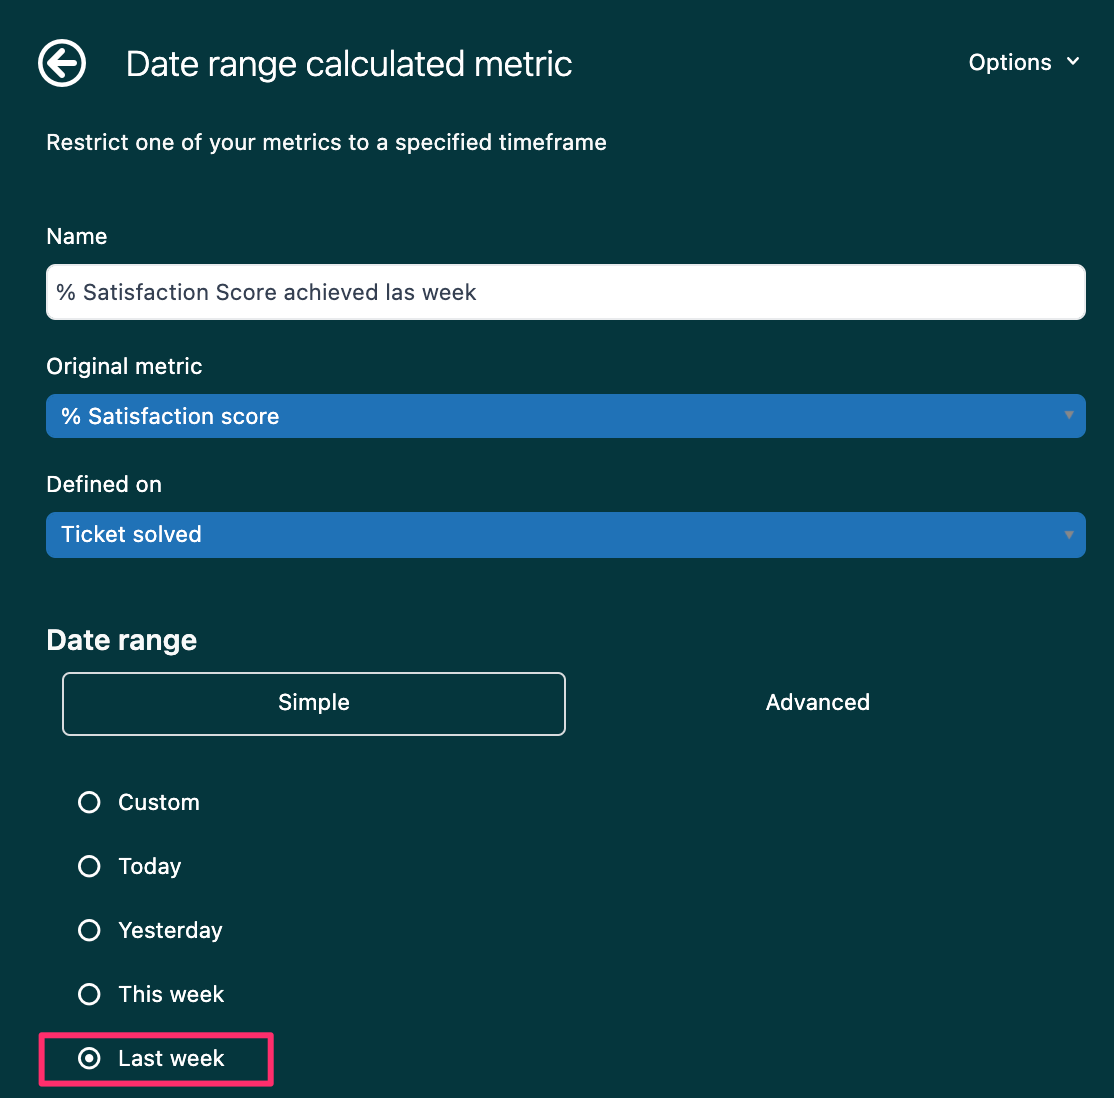
 - Create a new date range calculated metric called % Satisfaction score achieved last week and set it up as follows:
- Original metric: % Satisfaction Score
- Defined on: Ticket Solved
- Date range: Simple - Last week
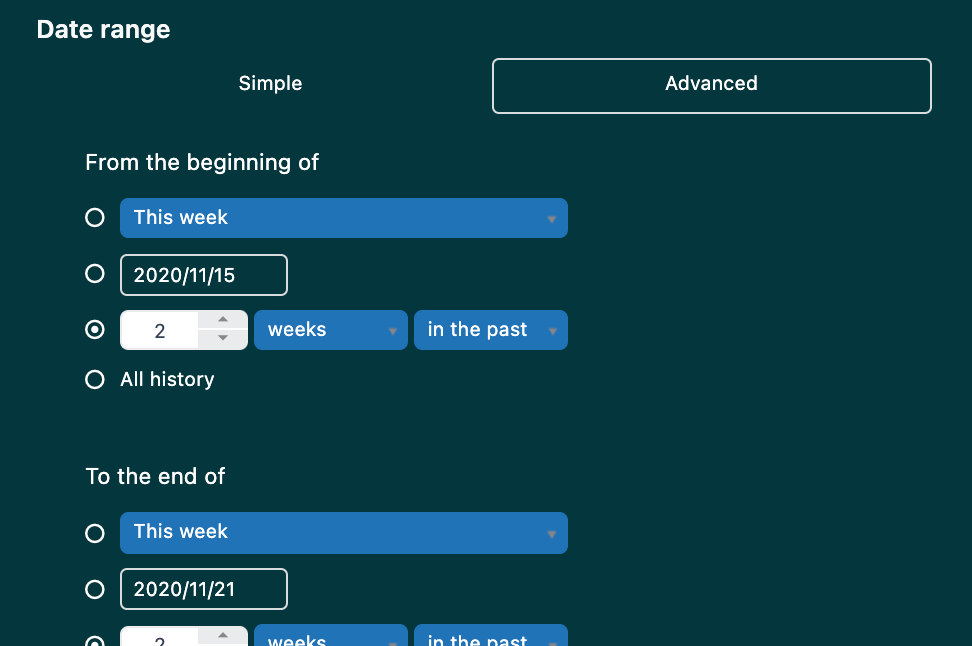
6. Create a new date range calculated metric called % Satisfaction score achieved week before last and set it up as follows:
- Original metric: % Satisfaction Score
- Defined on: Ticket Solved
- Date range: Advanced
- From the beginning of: 2 weeks in the past
- To the end of: 2 weeks in the past
7. In the Metrics panel, click Add.
8. From the list of metrics, choose Calculated metrics > % Satisfaction score achieved last week and Calculated metrics > % Satisfaction score achieved week before last, then click Apply.
9. Ensure the metric aggregators for the custom metrics are set to SUM. For more information, see Choosing metric aggregators.
10. From the Result manipulation ( ) menu, click Result metric calculation.
11. In the Result metric calculation menu, click Add a new metric.
12. Add the metric below by clicking Insert to add the metrics to the formula.
(SUM(% Satisfaction Score achieved this week)-SUM(% Satisfaction Score achieved last week))/SUM(% Satisfaction Score achieved last week)
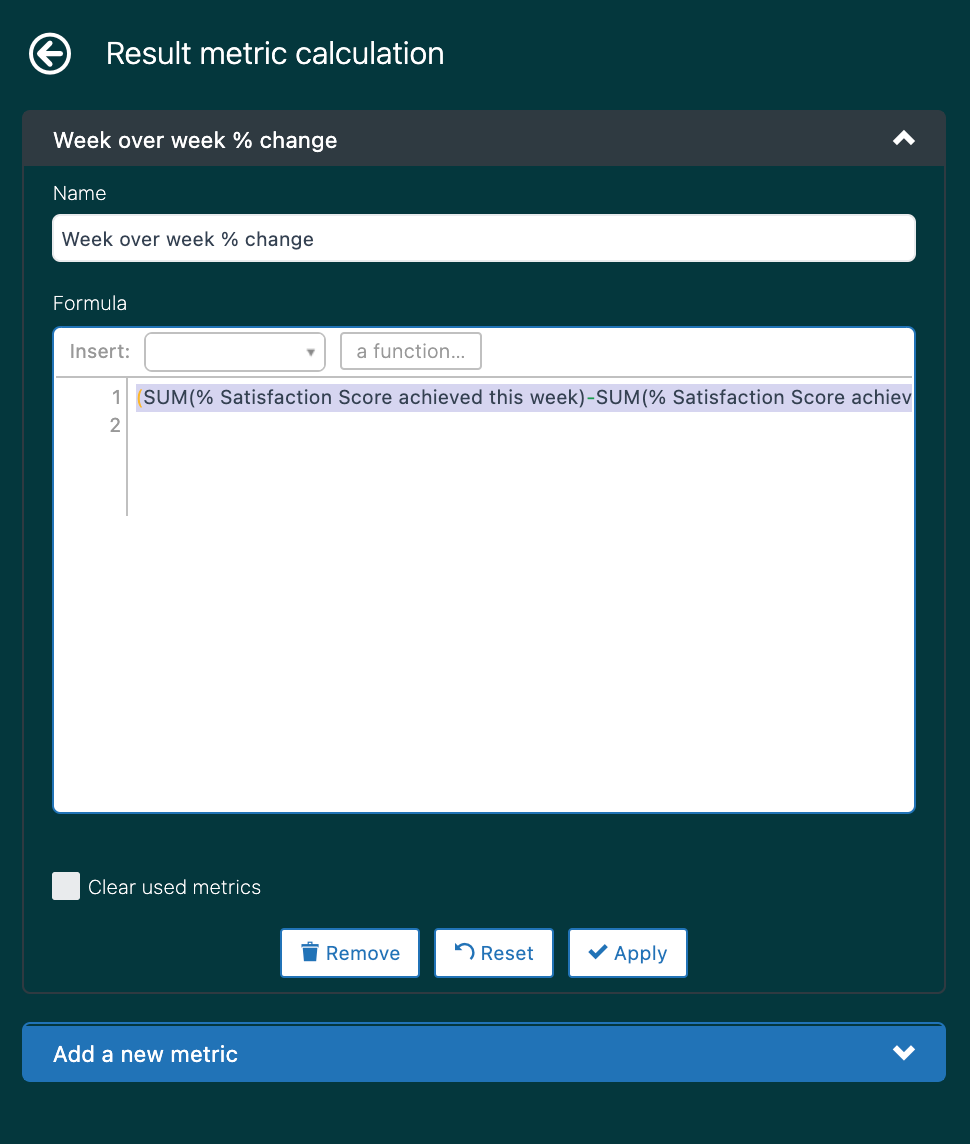
13. When you are finished, click + Add.
14. From the Chart configuration ( ) menu, click Display format.
15. On the Display format page, set all metrics to display in %.

16. From the Visualization type (![]() ) menu, click Table.
) menu, click Table.
The query is complete. See the screenshot below for an example of how it will look.

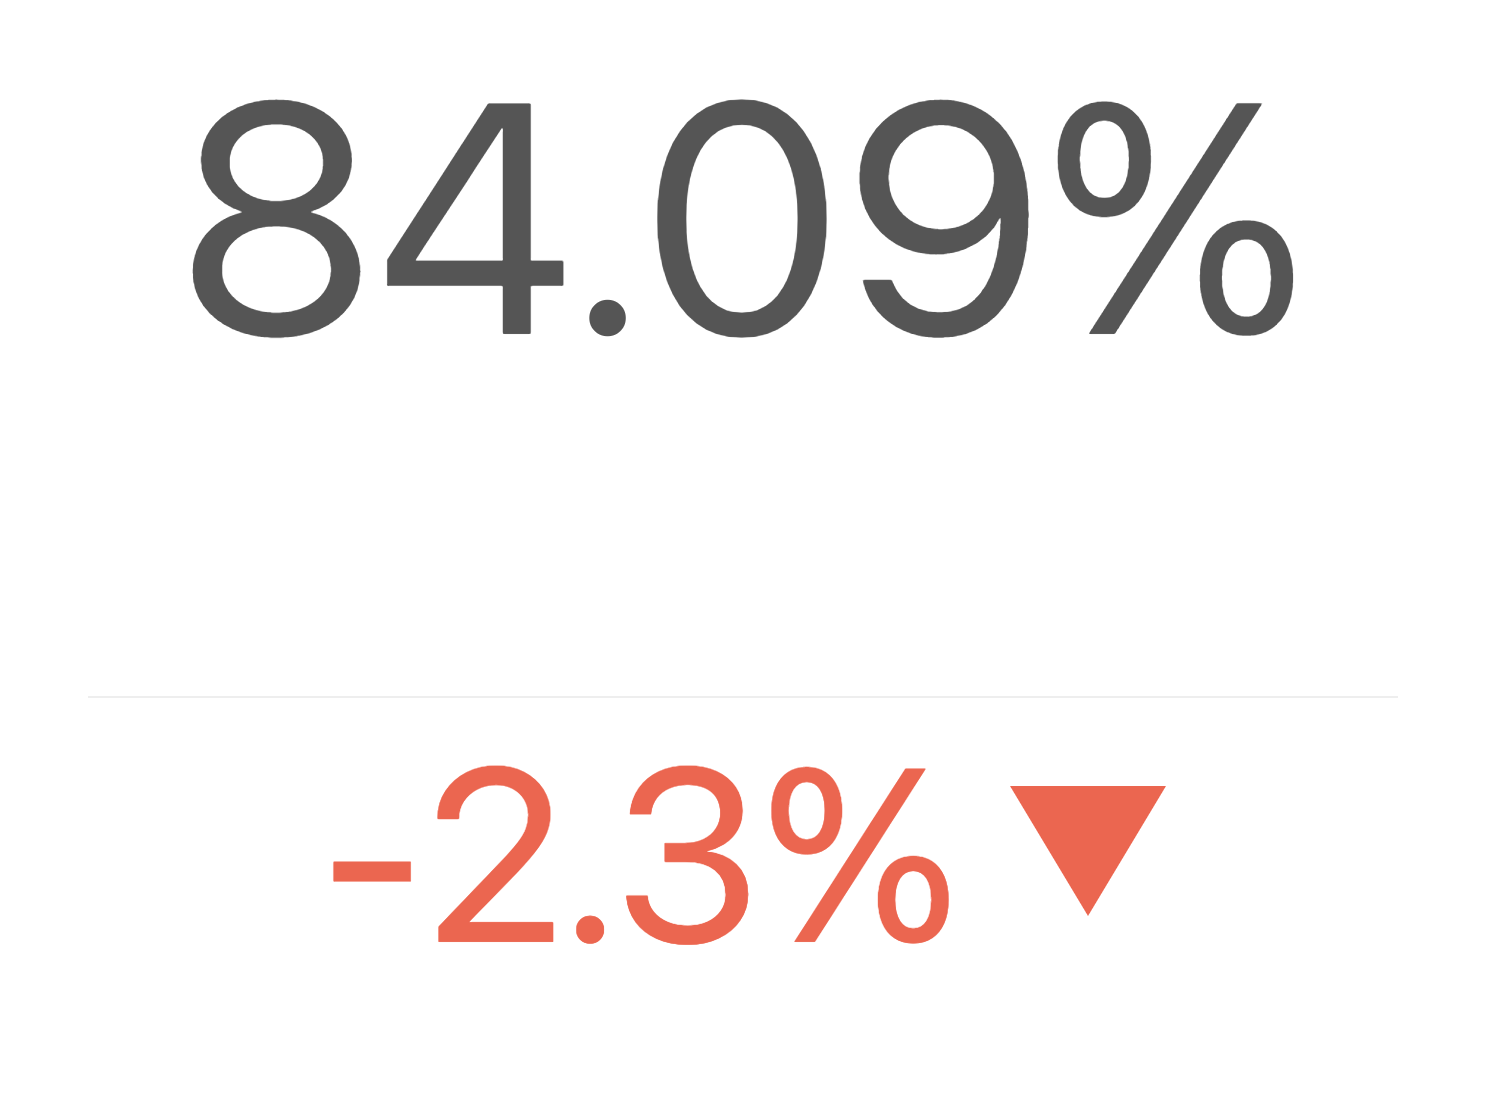
Additional: You could also look at changing the format of this report to be a KPI report instead. It will look something like the below.